


Johannes is a graduate from Bradford University, School of Management and after a career of 15 years as Project Manager decided to start his own life as a Financial Day trader. Originally from the Netherlands, during his career he has been living in many different countries, including long stops in Singapore and in recent years the Russian Federation. His main interest is exploring the reason behind the cyclic nature of time. Johannes can be contacted at [email protected]
Part 1: Cyclic Time on the Financial Markets
It is often said that history repeats itself. Why is it then, that we ‘know’ this, but, do not ‘act upon it’ ? In fact, what really happens is, that we recognise cyclic time only after certain events have taken place and we compare those events to something that has happened in the past. We do not know the reasons for these cycles, and frankly, we tend not to bother with understanding them.
This lack of ‘drive’ to find out whether time truly is cyclic and why, changes as soon as you start looking into Financial Trading. As soon as you realise that your bread and butter depends on understanding why the price of a company’s stock goes up or down, you start to get interested in understanding ANY reason behind these price movements. Any type of forecasting that has a higher rate of success than 50%, is directly related to the income you have.
A typical Financial chart, showing the Euro — US Dollar exchange rate from 2010 until current, every green or red bar represents one week.
The longer you look at the typical financial charts that track the price movements of stocks, commodities, currency exchange rates, etc. The more you start seeing repetitions of patterns. This phenomenon is pretty widely known in the financial world, there are traders that use techniques of Fibonacci numbers, Gartley price patterns, Elliot Waves, Japanese Candle Sticks…. the list goes on and on. The idea behind all these methods is: when a certain pattern appears, there is a high chance of a certain movement of price directly afterwards. And therefore, you base your trading decision accordingly.
If this ‘Pattern-trading’ were to work to a statistically significant level, then all traders would be rich and everybody else would be trading too. This is not the case, however.
The patterns exist, and often have a favourable outcome to them. But, sometimes the outcome is not the one that is expected and it then depends on the trading skills of the trader to keep his losses to a minimum.
It is interesting to note at this point that most of the people who have studied these patterns of the financial markets and wrote books about them, rarely go into the subject of: ‘Why’. Why do these patterns appear? It seems logical that if you understand why a pattern appears that you also understand what the outcome of the pattern will be.
If you were to ask a trader to name one historic figure that attempted to explain why these patterns appear on the charts, most likely you will receive the answer: ‘W.D. Gann’, (http://en.wikipedia.org/wiki/W._D._Gann). His name is probably as widely used in the trading world as Fibonacci’s. Gann was a trader from the early 1900’s and wrote many books on his esoteric approach to forecasting the markets. His books however, are written in such a way that many people since have been breaking their heads on what it actually was that he was communicating. There are as many interpretations of his works as there are traders, and people who study his works divide themselves typically between: ‘A student of Gann’, and ‘I have finally cracked Gann’s secrets!’. Both categories of people refuse to explain the ‘Why’ of cyclic time.
In addition to Gann, the other person often cited with the discovery of cyclic time within the markets is ‘N.D. Kondratiev’, (http://en.wikipedia.org/wiki/Nikolai_Kondratiev), also giving no insights into the question of ‘Why’.
So in other words: if you realise that understanding price patterns correlates to your income, and when you realise that nobody out there is satisfactory explaining why these patterns occur, you are pretty much left to your own research. Or, you drop the topic, of course.
I set out to do my own research. And I want to share my findings with you. Not from the perspective of trading the financial markets, however. What I want to do is create an awareness of cyclic time, and why, I believe, these cycles are occurring.
First of all, I will continue this writing with the help of ‘financial trading’. I believe that the two-dimensional charts are like a hole in a big fence. Through these charts it is possible to see the workings of time in a very precise way.
One thing that is obviously clear from the works of W.D. Gann, is that he used astrology. Many of the drawings that he made in his works contain astrological symbols of planets and zodiac signs. I would love to include a picture in this article to demonstrate my point, but I am a bit wary of copyrights. The best thing to do is search the web for his famous ‘Soya beans’ chart from 1948. It clearly shows a line labelled ‘Jupiter’.
So I had a starting point for my research. And anyone who has a bit of knowledge of Hindu Astrology will know that the relationship between the position of planets and the perceived value of commodities is being tracked already for many thousands of years. Why did we forget this? It weren’t just the ancient Hindus, the Babylonians were making such observations too. You can look into a translation of the Babylonian work ‘Enuma Anu Enlil’, to find such passages as:
“If on the fifteenth or fourteenth of Nisannu (March/April) five disks come up: business will be reduced.
If with it a cloud bank lies on the right of the sun: the trade in barley and straw will expand.
Watch the opposition of the Pleiades and the moon, and all this will give you the proper answer.”
With these hints of Astrology being behind the movement of prices, and with a hungry stomach in the background, I started to look for ANYTHING that I could find on this topic.
One of the first things that I found to show me something statistically significant, was the longitude of the Moon. It so happens that when the Moon crosses into the sign of Aries, there is a strange sudden movement in the charts that I am looking at. It should be mentioned that ‘coincidentally’, when a planet moves into Aries, that its longitude changes from 359 degrees into 0 degrees and therefore starts a new cycle.
The two examples above are again from the Euro — US Dollar exchange rate. And what we see is a sudden downward movement, one bar represents one hour. For the attentive readers: you will notice that the chart on the right shows the movement on December the 2nd, while the Moon crossed into Aries on December the 4th. It must be noted here that the 4th of December was a Sunday, and therefore the markets were closed. These ‘Friday movements’ are consistent, if the price HAS to move during the weekend, it WILL happen on the Friday before.
So at this point I became less hungry, but still not fully satisfied with understanding ‘Why’.
I grew up in a small village, having chickens or other animals around was quite common. In these settings you often hear people speaking about how Full Moon affects animals. Well, it affects people too. I, for example, cannot sleep at all when it’s Full Moon. It sounds stupid, but it is again one of those patterns you discover when you’re staring out of the window in the middle of the night, worrying about having to go to work the following morning. And as you gaze out of the window, ‘It’ is there again, just like the previous time, hanging in the sky, making fun of you.
As I continued my research into this 0 degrees Aries phenomenon, I discovered that it is actually not 0 degrees Aries at all. With the Moon it is not so obvious, because of its relative size. But, if you analyse Mars (which is relatively much smaller to us), you will discover that the point of the sudden price movement is closer to 4 degrees Aries.
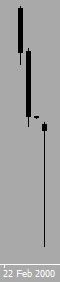
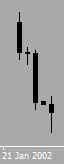
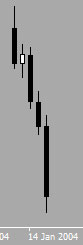
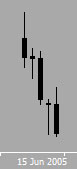
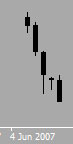
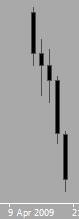
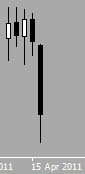
A compilation of pictures of Mars crossing the relative point of 0-8 degrees Aries. One bar represents one day.
For a long time I was searching for the ‘Why’ at 4 degrees Aries, and one day it struck me that I was not looking into the right direction. It so happens that 90 degrees ‘earlier’ in the sky, you will find the Galactic Center, at a comfortable 267 degrees longitude.
Some thoughts started to fall into place. The price movements that I was observing were following the point of relative mass (or gravity if you will). That is the reason that sometimes the price movement occurred at 4 degrees Aries and sometimes even at 8 degrees. The point changes according to the distribution of mass of our Solar System. I started making computer models that analysed the movement of price compared to all the known mass in our Solar System, RELATIVE to us. (I used the Swiss Ephemerides from Astrodienst in Switzerland, these programs are in the public domain)
An analysis of Euro — USD, compared to relative mass of Solar System period of 2008 to present, one bar represents one week.
I was very happy with these discoveries. But not completely satisfied yet. Obviously this theory had merit at this point, but I was not able to fine-tune it to such a level that it was able to forecast extremely accurate. The reason for this I believe to be because of the thousands of objects in our Solar System that I am not able to track.
So I set out to trick the system. I made a new program that would compare the current known situation in the Solar System, to all its previous situations that were similar. And, I would take the average price movements of these previous occurrences. That worked great, and I have been publishing my forecasts on my YouTube channel: www.youtube.com/mijnneef2
It doesn’t always work, but at least the success rate can be measured in numbers. In my statistics at least one week out of five is a complete failure and one other week is ‘difficult to trade’. Which means a 70% succes rate.
The problem with this program was that it worked up until Jupiter. Because any planet at a further distance has a cycle time that goes way beyond the historic price movements that I posses. For example the Euro — US Dollar that I used as examples only go back to 1998 when the Euro was introduced. Keeping in mind that a full Geocentric orbit of Saturn takes well into 21 years.
I figured that to improve my theories, I would need a ‘History’ that was much longer. And after some meditation on the topic, I decided to use Wikipedia. It has an incredible database of world events (otherwise known as the ‘News’), over a very long period of time.
Part 2: Cyclic Time in World Events
So, based on the same idea: Comparing the current relative mass distribution of the Solar System with past dates of the same state. I made a new program that would ‘pluck’ news from Wikipedia, then filter out those events that share common words, and I started tracking.
After about a year of tracking the news, it became clear that the program had a high success rate in the areas of: Politics, Sport and Accidents. All these topics are directly related to humans. While, other topics such as: Weather and Earthquakes, seemed less cyclic.
There are a few problems with forecasting the news and communicating this to other people. The biggest issue I faced was deciding whether something really happened, was a coincidence, or did not happen at all. The reason for this is because there are no fixed rules for such a choice. It is difficult to make this branch of research statistically measurable.
Was this accurate, was it a coincidence, or was this nothing at all?
The other problem involves the attention-span of a human. If I were to make a forecast about 10 years into the future, then probably nobody is going to keep track of it. On the other hand, if I do a forecast that is for next week, then everybody is saying ‘Yes, sure, that is to be expected, that issue has been going on for quite some time now’. So a forecast needs to balance between being ‘far away enough’ to come as a surprise to people, but ‘close by enough’ to keep people actually interested in hearing you out.
The last problem I face with other people is that they tend to look at these forecasts as if it were to be something clairvoyantly done, or paranormal. And they use every opportunity to tell me that I was wrong in my ‘predictions’. It seems difficult to understand that what I am showing is not a PREDICTION of the future, but a tendency towards CYCLIC TIME. It does not mean that the future will have to happen exactly as the past, it means that it will resemble the past. A cow is an animal, but not all animals are cows. Some cows give birth in April, others in August.
Was this accurate, was it a coincidence, or was this nothing at all?
(Yes, the difference in degrees can be explained by the position of other planets)
So I decided to put the forecasts online for a period of 3 to 6 months into the future, and let people decide for themselves whether they like it or not. You can have a look at the results of the program at: http://snakebearer.narod2.ru it gets updated roughly every other month. Past records are not being kept as I really do not like the discussion about ‘predicted’ events that happened or not.
Was this accurate, was it a coincidence, or was this nothing at all?
(The start of the Arab Spring inner circle, The end of North-African conflicts for independence outer circle)
(both in Egypt)
Part 3: A Meditation on ‘Why’ Cyclic Time seems to occur
While doing all of this, the thoughts going through my mind were about a certain ‘predetermination’ in life. Things happen because they have to happen, and they could not have happened in any other way. This idea is demonstrated more clearly by a few mental exercises:
We understand that the position of planetary bodies around us, have a certain effect on our brains. Our sleep patterns are disturbed, we make decisions to buy or sell Euros or Dollars, we demonstrate, go to war and cause accidents. In other words, our mental state is being affected. At the same time we are hearing a lot about 2012, about alignments, about spiritual growth. I have a hard time ignoring the similarities. The alignments that have been taking place since 2011 and will take place in 2012, are the same mass/gravity-distribution cycles that I see on the financial charts. I believe for 100% that the words ‘2012’, ‘alignment’, and ‘spiritual growth’ are related to each other in a very strong way.
At the same time I have noticed an increase in articles on the topic of the multidimensionality of space. As I said earlier, by looking at a two dimensional chart, I learned about the three dimensional cosmos. The planets move in 3D, but the chart can move only up or down. The results are finite. If we were to accept the idea that the events in our 3D world are also finite, in other words, predetermined, then we can extrapolate the idea that the universe is indeed multi-dimensional by the following thought: Imagine a one dimensional world. It is obviously a straight line for us. It has to be a line, it cannot be anything else but the line. Suppose now, that we are looking at ourselves from the 5th dimension if such a place were to exist. Our world as we know it would look like a line and we will always be the line, we cannot be anything else than the line. If we were to be a line, then for sure, we would have predetermination. Since we observe predetermination in our world (or at least I believe so), we therefore ‘know’ that there must be higher dimensions.
This exercise can be done the other way around, as well. We as humans are unfortunately not very good at imagening a four dimensional figure. Luckily, we have YouTube, and you can watch a four dimensional cube here: http://www.youtube.com/watch?v=cbprfcSVcyQ otherwise known as a Hypercube or Tesseract. Although this is a static figure in the four dimensional world, its manifestation in our three dimensional world FORCES it to rotate around its axis. It HAS to do so, it cannot appear static to us. And as it moves, there are repetitions, cycles. Perhaps this is the reason that our three dimensional universe appears cyclic? The reason being that higher dimensions exist, FORCES us to rotate.
The last food for thought: If we accept that mass affects our brains, and we know that matter occurs in the universe only for about 4% (the rest being dark matter or dark energy), then it follows that our brains are being ‘directed’ by just 4% of our ‘reality’. Are we going to DENY that the other 96% of the universe has any effect on us?
Part 4: A meditation on the Implications of Being Human
I decided to write a book on these topics, and I am looking forward to having it published in the near future (if the stars permit). The book will contain a lot more examples on financial trading and the news. I have also added a lot more food for thought as I venture deeper and deeper into the spiritual side of ‘predetermination’ and ‘reality’. In fact, what I would like to demonstrate in the book is that by understanding how reality takes shape around us, you will be able to use it to your advantage.
Furthermore, the book will explore the relationship between this ‘mass/gravity’ that affects our brains and the weak energy of life, referred to as Chi, Qi, Ki or Prana in the different oriental traditions. I will definitely try to submit an article on these topics to the team of GrahamHancock.com.
The reason that I believe there is a relationship is, because if we were to accept a multidimensional universe that has predetermination on the lower dimensions, it follows that our physical beings on this planet have a predetermined reason as well. My thinking is that our physical beings are also cyclic, or to say it differently: I am thinking in terms of reincarnation. An interesting side-trail to these thoughts is that the OTHER people that you are into contact with in this life are most likely also the result of the same cycle as you are. In other words, the people you meet in this life, are the same people you met in a previous life, you are connected. A further meditation on this brings me to the conclusion that up in a higher dimension, all the people I know and myself are, perhaps, more ‘physically’ connected. We, as a small group of relatives and friends together, make up a ‘Higher Identity’. Who in turn, perhaps, makes up an even higher identity together with others.
Please excuse my drawing skills
There are interesting techniques of meditation that involve what is called ‘Grounding’. It is the process of taking up into yourself the weak force of the Earth (matter). On the other hand you are connecting yourself with the higher forces that be, in effect creating a link between matter and spirit. For a better understanding of these topics I would like to refer you to the practice of ‘Reiki’, which is a Japanese form of healing through weak energy. An interesting fact is though that, the word ‘Reiki’ itself, exactly means: ‘Connection of matter with spirit’. As an additional food for thought, I believe that only WE in our dimension, are capable of connecting matter with spirit, because only WE exist within the 4% world of matter.
When meditating, usually the person takes up a rather uncomfortable pose with the spine straight and the head slightly moved backwards. The reason for this is that the body’s energy points, or Chakras, are alligned in such a pose. Together with the process of ‘Grounding’, you create a posture that is sometimes refered to as ‘Squaring the Circle’. You form a straight line on top of the circular Earth. Combining this with references on the act of meditation as being: ‘The way to Enlightment’, or other references such as: ‘Going to church for prayers, because prayers are the way to God’, almost give a feeling of obligation towards connecting matter with spirit, as if it were an officer’s duty. Mind you, going to church is usually a community thing. Are these perhaps the same people that make up your higher identity? Does going to a community church actually enhance the process of ‘Grounding’ your ‘combined higher Self’?
So with these open thoughts, I would like to end this article, and while I am very thankful for the time you spent reading this article, I do hope that you also found it to be WORTH your time. Time is rare, but in the spirit of this article: Time always comes back to you, it is meant to do so!
Namaste!